 Solo para Entendidos

El web scraping es una buena habilidad para diferentes usos más allá de que se sea un científico de datos o no. Mucha información que reside en la web es útil para ser analizada y elaborada. Este post sobre web scraping con Python, está dividido en tres partes.
• Extracción de datos de la web usando el módulo Beautiful Soup
• Manipulación de datos y limpieza usando la librería Panda
• Visualización de datos mediante Matplotlib
El dataset usado en este tutorial fue tomado de una carrera que tuvo lugar en Hillsboro, OR en Junio de 2017. Se podrá responder entonces preguntas como:
• Cuál fue el tiempo promedio de los corredores?
• Los tiempos de llegada responden a una distribución normal?
• Hubo diferencia de tiempos entre mujeres y hombres de diferentes grupos de edades?
Web Scraping con BeautifulSoup
Usando Jupyter Notebook, se deben importar las librerías necesarias (pandas, numpy, matplotlib.pyplot, seaborn). Si no lo tienes instalado, se recomienda utilizar Anaconda con ese fin. Para visualizar los gráficos, asegurarse de incluir la línea %matplotlib inline como se muestra a continuación.
import pandas as pd
import numpy as np
import matplotlib.pyplot as plt
import seaborn as sns
%matplotlib inline
Las librerías especificas de web scraping son urllib.request, que es usado para abrir URLs y el paquete BeautifulSoup que es usado para extraer los datos de los html.
from urllib.request import urlopen
from bs4 import BeautifulSoup
Seguido, hay que especificar la URL que contiene el dataset en urlopen() para obtener el html de la página.
url = "http://www.hubertiming.com/results/2017GPTR10K"
html = urlopen(url)
El primer paso entonces será obtener el hatml de la página, seguido, crear un objeto BeautifulSoup pasando el html a BeautifulSoup(). Este paquete es usado para parsear el html crudo en objetos de Python. El segundo argumento ‘lxml’ lo veremos después.
soup = BeautifulSoup(html, 'lxml')
type(soup)
bs4.BeautifulSoup
El objeto soup permite extraer información interesante sobre el website como el título tal como se muestra aquí.
# Get the title
title = soup.title
print(title)
<title>2017 Intel Great Place to Run 10K \ Urban Clash Games Race Results</title>
También se puede obtener el texto e imprimirlo para verificar que sea lo esperado.
# Print out the text
text = soup.get_text()
#print(soup.text)
Se puede ver el html de una página web haciendo right-clicking en cualquier lugar y seleccionando “Inspect.”
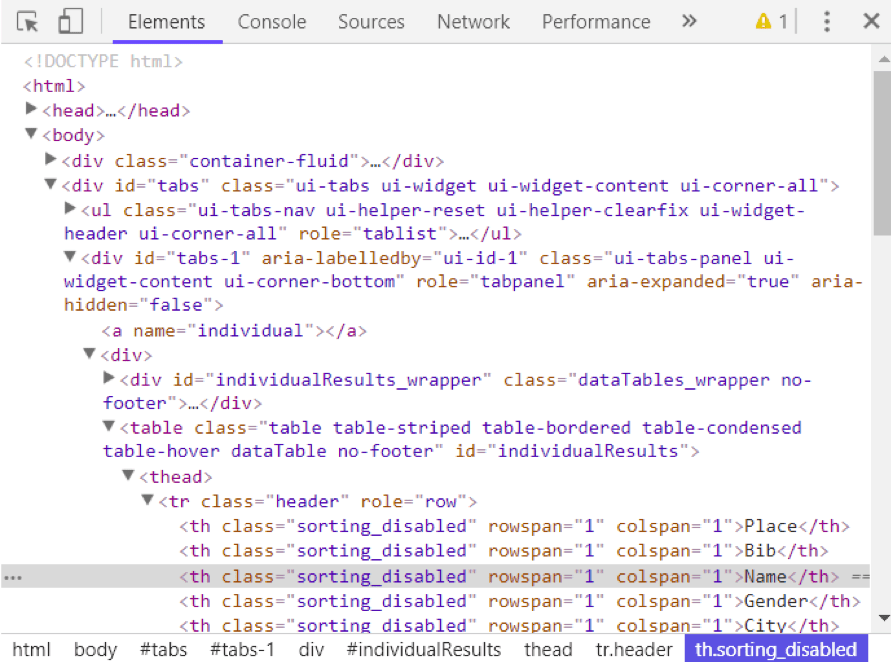
Usando el método find_all() de soup se pueden extraer todos los tags de html dentro de una página web. Ejemplos útiles de tags son < a > para hyperlinks, < table > para tables, < tr > para table rows, < th > para table headers, y < td > para table cells.
soup.find_all('a')
[<a class="btn btn-primary btn-lg" href="/results/2017GPTR" role="button">5K</a>,
 <a href="http://hubertiming.com/">Huber Timing Home</a>,
 <a href="#individual">Individual Results</a>,
 <a href="#team">Team Results</a>,
 <a href="mailto:timing@hubertiming.com">timing@hubertiming.com</a>,
 <a href="#tabs-1" style="font-size: 18px">Results</a>,
 <a name="individual"></a>,
 <a name="team"></a>,
 <a href="http://www.hubertiming.com/"><img height="65" src="/sites/all/themes/hubertiming/images/clockWithFinishSign_small.png" width="50"/>Huber Timing</a>,
 <a href="http://facebook.com/hubertiming/"><img src="/results/FB-f-Logo__blue_50.png"/></a>]
Como se puede ver en la salida anterior, los tags de html vienen a veces con atributos scomo class, src, etc. que proveen información adicional sobre los elementos. Se puede usar un loop y el método get(‘”href”) para extraer solo hyperlinks.
all_links = soup.find_all("a")
for link in all_links:
    print(link.get("href"))
/results/2017GPTR
http://hubertiming.com/
#individual
#team
mailto:timing@hubertiming.com
#tabs-1
None
None
http://www.hubertiming.com/
http://facebook.com/hubertiming/
Para imprimir solo filas de tablas, hay que pasar a soup.find_all() el argumento ‘tr’.
# Print the first 10 rows for sanity check
rows = soup.find_all('tr')
print(rows[:10])
[<tr><td>Finishers:</td><td>577</td></tr>, <tr><td>Male:</td><td>414</td></tr>, <tr><td>Female:</td><td>163</td></tr>, <tr class="header">
<th>Place</th>
<th>Bib</th>
<th>Name</th>
<th>Gender</th>
<th>City</th>
<th>State</th>
<th>Chip Time</th>
<th>Chip Pace</th>
<th>Gender Place</th>
<th>Age Group</th>
<th>Age Group Place</th>
<th>Time to Start</th>
<th>Gun Time</th>
<th>Team</th>
</tr>, <tr>
<td>1</td>
<td>814</td>
<td>JARED WILSON</td>
<td>M</td>
<td>TIGARD</td>
<td>OR</td>
<td>00:36:21</td>
<td>05:51</td>
<td>1 of 414</td>
<td>M 36-45</td>
<td>1 of 152</td>
<td>00:00:03</td>
<td>00:36:24</td>
<td></td>
</tr>, <tr>
<td>2</td>
<td>573</td>
<td>NATHAN A SUSTERSIC</td>
<td>M</td>
<td>PORTLAND</td>
<td>OR</td>
<td>00:36:42</td>
<td>05:55</td>
<td>2 of 414</td>
<td>M 26-35</td>
<td>1 of 154</td>
<td>00:00:03</td>
<td>00:36:45</td>
<td>INTEL TEAM F</td>
</tr>, <tr>
<td>3</td>
<td>687</td>
<td>FRANCISCO MAYA</td>
<td>M</td>
<td>PORTLAND</td>
<td>OR</td>
<td>00:37:44</td>
<td>06:05</td>
<td>3 of 414</td>
<td>M 46-55</td>
<td>1 of 64</td>
<td>00:00:04</td>
<td>00:37:48</td>
<td></td>
</tr>, <tr>
<td>4</td>
<td>623</td>
<td>PAUL MORROW</td>
<td>M</td>
<td>BEAVERTON</td>
<td>OR</td>
<td>00:38:34</td>
<td>06:13</td>
<td>4 of 414</td>
<td>M 36-45</td>
<td>2 of 152</td>
<td>00:00:03</td>
<td>00:38:37</td>
<td></td>
</tr>, <tr>
<td>5</td>
<td>569</td>
<td>DEREK G OSBORNE</td>
<td>M</td>
<td>HILLSBORO</td>
<td>OR</td>
<td>00:39:21</td>
<td>06:20</td>
<td>5 of 414</td>
<td>M 26-35</td>
<td>2 of 154</td>
<td>00:00:03</td>
<td>00:39:24</td>
<td>INTEL TEAM F</td>
</tr>, <tr>
<td>6</td>
<td>642</td>
<td>JONATHON TRAN</td>
<td>M</td>
<td>PORTLAND</td>
<td>OR</td>
<td>00:39:49</td>
<td>06:25</td>
<td>6 of 414</td>
<td>M 18-25</td>
<td>1 of 34</td>
<td>00:00:06</td>
<td>00:39:55</td>
<td></td>
</tr>]
El objetivo es tomar de la tabla del sitio y convertirlo en un dataframe para utilizar la información más fácilmente con Python. Para eso usaremos un loop que itera a través de las filas e imprime las celdas en las filas.
for row in rows:
    row_td = row.find_all('td')
print(row_td)
type(row_td)
[<td>14TH</td>, <td>INTEL TEAM M</td>, <td>04:43:23</td>, <td>00:58:59 - DANIELLE CASILLAS</td>, <td>01:02:06 - RAMYA MERUVA</td>, <td>01:17:06 - PALLAVI J SHINDE</td>, <td>01:25:11 - NALINI MURARI</td>]


bs4.element.ResultSet
La salida muestra que se imprimen las filas con los tags de HTML, cosa que no queremos, pero podemos usar el remove de HTML del soup, get_text.
str_cells = str(row_td)
cleantext = BeautifulSoup(str_cells, "lxml").get_text()
print(cleantext)
[14TH, INTEL TEAM M, 04:43:23, 00:58:59 - DANIELLE CASILLAS, 01:02:06 - RAMYA MERUVA, 01:17:06 - PALLAVI J SHINDE, 01:25:11 - NALINI MURARI]
Using regular expressions is highly discouraged since it requires several lines of code and one can easily make mistakes. It requires importing the re (for regular expressions) module. The code below shows how to build a regular expression that finds all the characters inside the < td > html tags and replace them with an empty string for each table row.
First, you compile a regular expression by passing a string to match to re.compile(). The dot, star, and question mark (.*?) will match an opening angle bracket followed by anything and followed by a closing angle bracket. It matches text in a non-greedy fashion, that is, it matches the shortest possible string. If you omit the question mark, it will match all the text between the first opening angle bracket and the last closing angle bracket. After compiling a regular expression, you can use the re.sub() method to find all the substrings where the regular expression matches and replace them with an empty string. The full code below generates an empty list, extract text in between html tags for each row, and append it to the assigned list.
import re

list_rows = []
for row in rows:
    cells = row.find_all('td')
    str_cells = str(cells)
    clean = re.compile('<.*?>')
    clean2 = (re.sub(clean, '',str_cells))
    list_rows.append(clean2)
print(clean2)
type(clean2)
[14TH, INTEL TEAM M, 04:43:23, 00:58:59 - DANIELLE CASILLAS, 01:02:06 - RAMYA MERUVA, 01:17:06 - PALLAVI J SHINDE, 01:25:11 - NALINI MURARI]

str
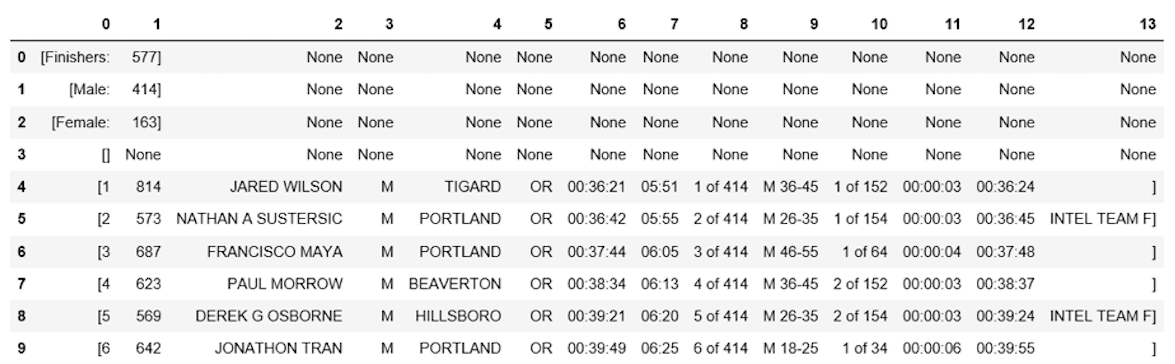
The next step is to convert the list into a dataframe and get a quick view of the first 10 rows using Pandas.
df = pd.DataFrame(list_rows)
df.head(10)
| 0 | |
|---|---|
| 0 | [Finishers:, 577] |
| 1 | [Male:, 414] |
| 2 | [Female:, 163] |
| 3 | [] |
| 4 | [1, 814, JARED WILSON, M, TIGARD, OR, 00:36:21… |
| 5 | [2, 573, NATHAN A SUSTERSIC, M, PORTLAND, OR, … |
| 6 | [3, 687, FRANCISCO MAYA, M, PORTLAND, OR, 00:3… |
| 7 | [4, 623, PAUL MORROW, M, BEAVERTON, OR, 00:38:… |
| 8 | [5, 569, DEREK G OSBORNE, M, HILLSBORO, OR, 00… |
| 9 | [6, 642, JONATHON TRAN, M, PORTLAND, OR, 00:39… |
Manipulación y Limpieza de Datos
El dataframe no está en el formato que pretendemos, para limpiarlo, debemos dividir la columna 0 en varias en la posición de la coma usando el método str.split().
df1 = df[0].str.split(',', expand=True)
df1.head(10)
El dataframe tiene corchetes no deseados en cada fila, se puede usar el método strip() para eliminarlos en la columna “0.”
df1[0] = df1[0].str.strip('[')
df1.head(10)
La tabla no tiene encabezados, se puede usar el método find_all() para armarlo
col_labels = soup.find_all('th')
Como con las filas de tabla, se puede usar Beautiful Soup para extraer los textos de los tags del HTML para los headers.
all_header = []
col_str = str(col_labels)
cleantext2 = BeautifulSoup(col_str, "lxml").get_text()
all_header.append(cleantext2)
print(all_header)
['[Place, Bib, Name, Gender, City, State, Chip Time, Chip Pace, Gender Place, Age Group, Age Group Place, Time to Start, Gun Time, Team]']
Convertir lista de encabezados en un dataframe de pandas.
df2 = pd.DataFrame(all_header)
df2.head()
| 0 | |
|---|---|
| 0 | [Place, Bib, Name, Gender, City, State, Chip T… |
De igual forma, se puede separar la comuna 0 en múltiples columnas en la posición de la coma para todas las filas
df3 = df2[0].str.split(',', expand=True)
df3.head()

Los dos dataframes pueden ser concatenados en uno el método concat()
frames = [df3, df1]

df4 = pd.concat(frames)
df4.head(10)

Cómo asignar la primera fila a la cabecera de la tabla.
df5 = df4.rename(columns=df4.iloc[0])
df5.head()

Ya en estado formateado, se puede sacar un overview de los datos para evaluar
df5.info()
df5.shape
<class 'pandas.core.frame.DataFrame'>
Int64Index: 597 entries, 0 to 595
Data columns (total 14 columns):
[Place              597 non-null object
 Bib                596 non-null object
 Name               593 non-null object
 Gender             593 non-null object
 City               593 non-null object
 State              593 non-null object
 Chip Time          593 non-null object
 Chip Pace          578 non-null object
 Gender Place       578 non-null object
 Age Group          578 non-null object
 Age Group Place    578 non-null object
 Time to Start      578 non-null object
 Gun Time           578 non-null object
 Team]              578 non-null object
dtypes: object(14)
memory usage: 70.0+ KB


(597, 14)
La tabla tiene 597 filas y 14 columnas. Se pueden eliminar todas las de valores perdidos.
df6 = df5.dropna(axis=0, how='any')
La cabecera es replicada como la primera fila en df5.
df7 = df6.drop(df6.index[0])
df7.head()

Se puede hacer más limpieza renombrando las columnas ‘[Place’ and ‘ Team]’. Python es muy sensible con los espacios, asegúrese de incluir espacio después de las tildes en ‘ Team]’.
df7.rename(columns={'[Place': 'Place'},inplace=True)
df7.rename(columns={' Team]': 'Team'},inplace=True)
df7.head()

Ultimo paso, remover los corchetes en celdas en la columna “Team”.
df7['Team'] = df7['Team'].str.strip(']')
df7.head()

Listo!
Análisis y Visualización de Datos
La primera pregunta es el promedio de tiempos de llegada.
Hay que convertir la comuna “Chip Time” en minutos. Una manera es convertir la columna en una lista para manipularla
time_list = df7[' Chip Time'].tolist()

# You can use a for loop to convert 'Chip Time' to minutes

time_mins = []
for i in time_list:
    h, m, s = i.split(':')
    math = (int(h) * 3600 + int(m) * 60 + int(s))/60
    time_mins.append(math)
#print(time_mins)
El siguiente paso es convertir otra vez la lista en un dataframe y hacer una columna (“Runner_mins”) para los tiempos de llegada expresados en minutos.
df7['Runner_mins'] = time_mins
df7.head()

Cómo calcular estadísticas para columnas numéricas en un dataframe.
df7.describe(include=[np.number])
| Runner_mins | |
|---|---|
| count | 577.000000 |
| mean | 60.035933 |
| std | 11.970623 |
| min | 36.350000 |
| 25% | 51.000000 |
| 50% | 59.016667 |
| 75% | 67.266667 |
| max | 101.300000 |
Interesantemente los tiempos de llegada son de aproximadamente 60 min. El más rápido terminó en 36.35 mins, y el más lento en 101.30 minutos.
El boxplot es otra herramienta util para visualizar datos estadísticos (maximum, minimum, medium, first quartile, third quartile, incluyendo outliers).
from pylab import rcParams
rcParams['figure.figsize'] = 15, 5
df7.boxplot(column='Runner_mins')
plt.grid(True, axis='y')
plt.ylabel('Chip Time')
plt.xticks([1], ['Runners'])
([<matplotlib.axis.XTick at 0x570dd106d8>],
 <a list of 1 Text xticklabel objects>)

La segunda pregunta es si los tiempos de llegada forman una distribución normal
En este caso se usa la librería Seaborn donde se ve que la distribución parece casi normal.
x = df7['Runner_mins']
ax = sns.distplot(x, hist=True, kde=True, rug=False, color='m', bins=25, hist_kws={'edgecolor':'black'})
plt.show()

La tercera pregunta es cuando hay diferencia entre hombres y mujeres en diferentes grupos de edades.
f_fuko = df7.loc[df7[' Gender']==' F']['Runner_mins']
m_fuko = df7.loc[df7[' Gender']==' M']['Runner_mins']
sns.distplot(f_fuko, hist=True, kde=True, rug=False, hist_kws={'edgecolor':'black'}, label='Female')
sns.distplot(m_fuko, hist=False, kde=True, rug=False, hist_kws={'edgecolor':'black'}, label='Male')
plt.legend()
<matplotlib.legend.Legend at 0x570e301fd0>

La distribución indica que las mukeres fueron más lentas en promedio. Se puede usar el método groupby() para calcular los totales para los hombres y mujeres por separado.
g_stats = df7.groupby(" Gender", as_index=True).describe()
print(g_stats)
        Runner_mins                                                         \
              count       mean        std        min        25%        50%
 Gender
 F            163.0  66.119223  12.184440  43.766667  58.758333  64.616667
 M            414.0  57.640821  11.011857  36.350000  49.395833  55.791667


               75%         max
 Gender
 F       72.058333  101.300000
 M       64.804167   98.516667
El promedio de tiempo para todas las mujeres y hombres fue ~66
mins y ~58 mins, respectivamente.
df7.boxplot(column='Runner_mins', by=' Gender')
plt.ylabel('Chip Time')
plt.suptitle("")
C:\Users\smasango\AppData\Local\Continuum\anaconda3\lib\site-packages\numpy\core\fromnumeric.py:57: FutureWarning: reshape is deprecated and will raise in a subsequent release. Please use .values.reshape(...) instead
  return getattr(obj, method)(*args, **kwds)


Text(0.5,0.98,'')

fuente: datacamp